Understanding Data Analytics and its 4 Types
Data is a dynamic tool which is available to the organisations at an astonishing volume. Moreover, the data is increasing at an exponential rate. When harnessed accurately, it has the power and potential to drive business decision making, impact formulation of strategies, and improve the performance of an organisation.
What is Data Analytics?
Data is getting generated in an enormous volume as we are reading forward, this continuous generation of data opens up a new paradigm. In this tech savvy world, due to the availability of high computing power and colossal amount of data, we can use this data enables us to make decisions that can be fruitful to the organisation. The process of analysing data to identify trends, find answers, and draw conclusions is called data analytics. When applied to business, data analytics is often termed as business analytics.
Exploring Data Analytics
The term “data analytics” refers to a vast range of methods for examining data in order to derive insightful knowledge that might improve many operational elements. Businesses can increase overall efficiency and enhance processes by examining data to find metrics and patterns that might otherwise go overlooked.
For example, to guarantee for the best runtime of the machines, manufacturing businesses, gather data on machine runtime, downtime, and work queues, etc, which allows them to analyse, plan and enhance the planning of the workload.
Data analytics is applied across all industries. Some more examples are as follows: By the help of analytics, content providers optimize content placement and presentation. While analytics help gaming companies to create reward systems that effectively engage gamers and ultimately increase user engagement.
The operations, efficiencies and performance of numerous sectors can be benefitted with analytics by just spotlighting the patterns. This gives the organisations and businesses a competitive edge.
Types of Data Analytics
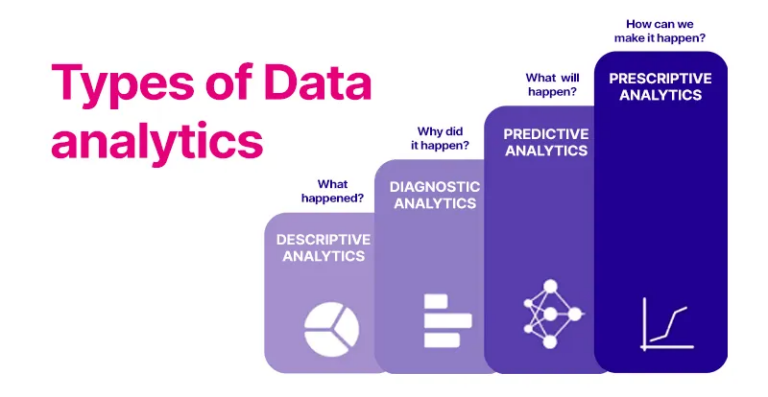
The modern data analytics can be grouped into 4 major types:
- Descriptive Analytics
- Diagnostic Analytics
- Predictive Analytics
- Prescriptive Analytics
Now, let’s understand them briefly to understand which kind of analytics we should use, when should we use and why to use.
1. Descriptive Analytics:
The most basic kind of analytics is descriptive analytics, which serves as the foundation for all other types. It enables us to extract patterns from raw or unprocessed data and provide a concise explanation of what has occurred or is occurring. The easiest way for a business to start is with this type of analytics as it allows them to analyse the overall performance at an aggregate level because the data is easily and readily available for constructing reports.
“What happened” is answered in descriptive analytics.
By looking into the data present from the past events to get insights, in descriptive analytics, analysis is done to channelise how to approach the future events. The performances from the past are examined by mining the historical data to understand the reason behind the success or failure. The most common professions for which this type of analytics is applicable are sales, marketing, operations, finance, etc. Charts, graphs and maps can show trends which can show the spikes or dips. Descriptive analytics is best for data visualisation as it fits with it.
The most common use cases for descriptive analytics can be the YoY (year-over-year) pricing changes, MoM (month-over-month) sales growth, total number of users, or revenue generated per subscriber. These details are really insightful to track patterns as these events have already taken over in the business over a period of time.
For example, consider a luggage selling company analysing a seasonal surge of sales. Here the descriptive analytics will tell them that “there was an increase of sales in the month of February, March and April each year.”
2. Diagnostic Analytics:
Diagnostic analytics is the next step after the descriptive analytics. It is a process of utilising data to understand the cause of the behaviour of trends and correlation among the variables. Unlike the descriptive analytics, which focusses on ‘what happened’, diagnostic analytics addressed to ‘why did the abnormality or deviation occurred within the data. In simple words, it is a way to determine why something happened. This analytics is best suited for finding the root cause of the problem in the data.
As mentioned above, it justifies the wise question of “why did this happen?”
Patterns, trends, and connections are found from the data that help explain why particular events happened, data analysts employ a variety of methods and techniques to carry all operations. Its primary objective is to provide information on the elements influencing a certain result or issue.
Diagnostic analytics benefits various sectors ranging across various domains. Some of the use cases are as follows: with the help of diagnostic analytics, HR professionals can easily understand employee turnover rate, pinpoint factors that are leading to low employee engagement and also identify the reasons behind the workplace conflicts. It also benefits the healthcare sector to spot the patterns and understand the reasons for readmission of patients and also effectiveness of treatments can be analysed. While IT sector also uses it for troubleshooting and resolving technical issues. Moreover, manufacturing companies implement diagnostic analytics to check for production inefficacies, for supply chain optimisations, etc. Customer behaviour can be understood using it for the retail sector.
For example, assume a small coffee noticed an increase in sales of iced coffee on Mondays than other days of the week. To understand the reason why this happened, they used diagnostic analytics. By analysing the weather pattern, they found out that Mondays are usually a bit hotter than the weather of rest of the week, which drives customers to drink cold beverage. Moreover, feedback from the customers suggested that many preferred cool and refreshing drink to kickstart their workweek. With the usage of this data, the coffee shop anticipates the reason behind this trend and gets prepared to stock up ingredients for iced coffee for every Monday, so as to meet the customer demand and provide active services.
3. Predictive Analytics:
Predictive analytics is process of using historical data to predict trend, patterns and events in the future. As the name ‘predictive’ suggests to forecast, it is an advanced form of analytics that is used to forecast the trends in the future, both short and long term. The historical data that constitutes in descriptive and diagnostic analytics is used to build the base of predictive analytics model. With the help of statistical algorithms, data analysis, and machine learning, highly precise and models can be built which in return can help to predict future outcomes.
It deals with the question “What might happen in the future?”
Predictive analytics benefits industries across various sectors. Let’s check out some of the use cases. In financial services, by identifying unusual transaction patterns, determining loan eligibility, forecasting stock price trends using historical data, etc, the detection of frauds can be aided. In B2B sector, demand forecasting, lead scoring to point out high potential clients, renewal of contracts for avoiding churning of customers, etc, can be done. Media sector uses it to predict the performance of the content and also to improve the advertisement campaigns. It is also potent for healthcare sector as it has the potential to predict outbreak of diseases. Last but not the least, e-commerce industry uses predictive analytics to improve customer participation through recommendations of the products, dynamic pricing, etc.
For example, imagine a bank seeks to forecast which customers who are likely to apply for home loan in the next quarter. So, they use predictive analytics model to study the existing customers with the details like income, savings, cibil score, spending power, etc. The model interprets the patterns and trends such as who are the customers whose salaries were incremented, or have growing savings, or those who were enquiring about the home loan frequently. According to these patterns, the model predicts the lists of individuals who are the most likely to apply for home loan soon. According to these reports and analysis, the bank can provide the customers with personalised offers and plans, which in return aids to mature the deal.
4. Prescriptive Analytics:
Prescriptive analytics is the main pillar of data analytics. It is often termed as the ‘future of data analytics’ and rightly so. Rather than just providing explanations or predictions, it recommends the decision makers to the best course of action heading forward. It is a process that uses data to determine an optimal recommendation and course of action. By considering all the relevant and useful factors, this analytics plans to provide the recommendations to the businesses for moving forward with a guided strategy. This power to provide guidance and support makes it the most important tool for decision makers to make data driven decisions.
Prescriptive analytics deals with the question “What should we do next?”
The historical data, the current real time data and all the data from relevant sources of the businesses and organisations is used for performing this process. In this, the descriptive, diagnostic and predictive analytics is effectively merged to make data-driven informed decisions.
Being the pinnacle of data analytics, it’s usage spans across a large number of sectors. Here are few use-case showing it capabilities. If we talk about the ecommerce platforms, the browsing and buying habits are observed and valid spot-on recommendations. In financial services, the frauds can be spotted by analysing the pattern of the transactions and customer behaviour, and providing adequate measures for protection. Media and entertainment industry uses prescriptive analytics to enhance their ad campaigns as it helps them to target the right people which makes it the best deal and improves their ROI. Other sectors and businesses like retail, e-commerce, healthcare, etc, also uses prescriptive analytics to make their work efficient and effective.
Conclusion:
In the world of data, having the knowledge about the 4 types of data analytics – descriptive, diagnostic, predictive and prescriptive, allows the businesses to know the patterns and flourish their businesses by making data informed decisions. Each type has its own uniqueness and capabilities, be it understanding past events or making strategies for the future, which makes them an essential across industries. In this competitive market, leveraging these techniques is a must. As the data grows exponentially, having an expertise of these techniques does not only enhance problem solving, but also opens room for growth and innovation.
If you are interested in learning how to actually use python for doingdata analysis, check out the link ahead – Data Analysis using Python