Data Representation Through Gantt Charts
In the world of project management, one of the most visually effective tools for tracking progress and planning tasks is the Gantt chart. Named after its creator, Henry Gantt, this chart has become an essential tool in various, fields from construction to software development, to monitor timelines and allocate resources efficiently.
History before Gantt Chart
Before Gantt, project tracking was a much more time-consuming, labour-intensive, and less visual process than it is currently. Traditional scheduling techniques are utilized, such as a list of tasks, calendars, and manual timelines. The written-out, long document form of projects leaves not a lot of flexibility in terms of adaptation or visual representation. Timelines and dependencies were shown as explicit calculations on paper and resulted in quite cumbersome workflows with very poor visibility for interdependency relationships between tasks.
Early tools and techniques in project management were simply charts or tables drawn on paper, showing deadlines, but offering little in the way of indicating overlapping tasks or dependencies. Updates to the project were always an exercise in the tedium of rewriting entire documents, as changes to one schedule reflected the need to make similar changes in another. Communication among team members was often a matter of in-person meetings, emails, and voluminous paperwork, complicating the process of project management.
A Gantt chart is a type of bar chart where the project schedule is given in visual form. Project tasks with their start and end dates are represented and readily viewed by seeing what should be done, by whom, and when. Gantt charts are excellent for planning and progress tracking and, hence, very valuable for beginners and experienced professionals alike.
Use Case
The first major application of the Gantt chart was during World War I. It was applied in order to manage weaponry production for the U.S. military. At this time, management was facing an extremely pressured environment with very tight timetables, a lack of resources, and big teams, meaning that the Gantt chart was what was exactly needed to define complex manufacturing processes. Its revolutionary capability to identify which tasks can be done simultaneously and which ones had dependencies over the others meant that, by managers, there could be effective resource allocation in such a way that wasteful time-consuming delays might be avoided.
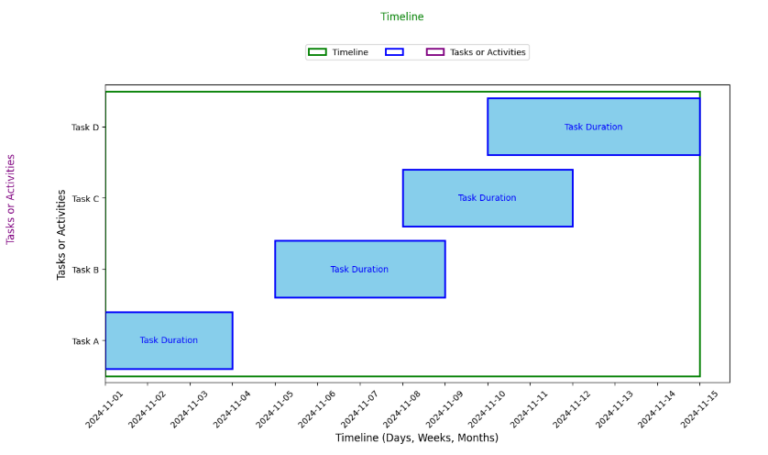
In a typical Gantt chart:
- The horizontal axis represents the timeline (days, weeks, months).
- The vertical axis lists all the tasks or activities in the project.
- Horizontal bars represent each task, with the length showing the duration of the task.

Why Use Gantt Charts?
Gantt charts are essential project management tools that provide graphic answers to many important questions: which tasks are to be completed, when tasks begin and end, any dependencies among tasks, and a trace of the progressing tasks with time. Thus, the very clear illustration of such factors gives the opportunity to conduct optimal resource allocation, avoid scheduling conflicts, and ensure on-time progression of the project in an efficient manner for effective delivery of the project.
Key Components of a Gantt Chart
Understanding the components of a Gantt chart is crucial for interpreting or creating one. Here’s a breakdown of the primary elements:
- Tasks: This is the individual activities required to complete the project.
- Timeline: The span over which the project will be carried out.
- Bars: Every bar represents a task, with its position and length are in respect to the task’s start and end dates.
- Milestones: Key points or deadlines in the project. They are typically marked as diamonds or other distinct symbols.
- Dependencies: These show relationships between tasks. For example, Task B cannot begin until Task A is complete.
Step-by-Step Guide to Creating a Gantt Chart
Step 1: List Tasks and Activities
Start by identifying all the tasks necessary to complete the project. Break down larger tasks into manageable components for better tracking.
Step 2: Set a Timeline
Determine the timeline for the entire project. Set start and end dates for each task based on your overall schedule.
Step 3: Arrange Tasks in Order
Organize tasks in the sequence they need to be completed. Some tasks may overlap, while others will need to be completed sequentially.
Step 4: Create Bars for Each Task
Draw a bar for each task based on its duration, with the start point representing the task’s start date and the end point representing the completion date.
Step 5: Add Dependencies and Milestones
Identify any dependencies between tasks and mark them on the chart. Add milestones at significant points to track major accomplishments.
Example: Gantt Chart in Action
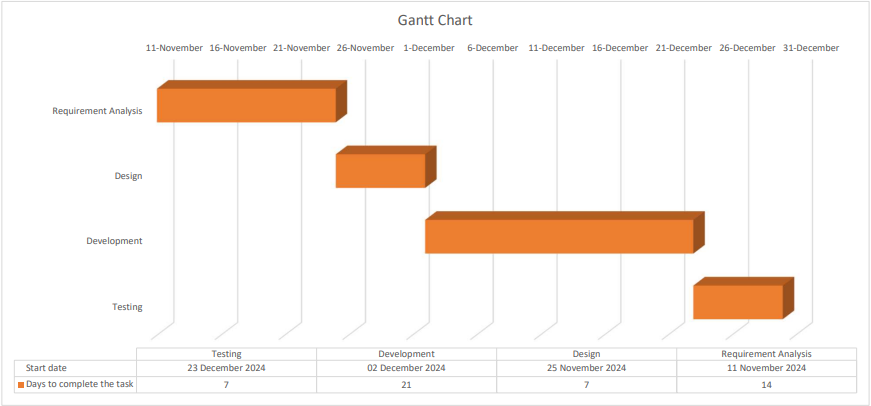
Let’s say you’re managing a software development project with the following tasks:
- Task 1: Requirement Analysis (2 weeks)
- Task 2: Design (1 week) – begins after Requirement Analysis
- Task 3: Development (3 weeks) – starts after Design
- Task 4: Testing (1 week) – starts after Development


This Gantt chart visualises your project schedule, showing how each task aligns with the others and helping you monitor dependencies.
Tools for Creating Gantt Charts
Several software tools make creating Gantt charts easier, even for beginners. Some popular options include:
- Microsoft Project: It is used for professional project management.
- Excel: It offers basic Gantt chart templates suitable for simple projects.
- Asana/Trello: It is Ideal for smaller teams.
- Jira: Excellent for Agile software development, providing Gantt like tracking with sprints and epics.
Benefits of Using Gantt Charts
- Clarity: Visualizing timelines and dependencies clarify complex projects.
- Organization: Breaking down tasks into smaller segments helps team members stay organized.
- Tracking: Gantt charts allow easy progress tracking and identifying bottlenecks.
- Resource Management: Helps assign and balance resources effectively to avoid overload.
Challenges with Gantt Charts
While Gantt charts are immensely useful, they have certain limitations:
- Complexity in Large Projects: In large projects with hundreds of tasks, Gantt charts can become cluttered and hard to read.
- Rigidity: Changes in task duration or dependencies require updates, which can be time consuming.
- Dependency Management: Managing dependencies manually can become challenging, especially if the project scope changes frequently.
Tips for Effective Gantt Chart Usage
- Keep It Simple: Avoid overloading the chart with too many details; focus on major tasks and dependencies.
- Use Colour Coding: Different colours can help distinguish between various task types or phases.
- Update Regularly: Keep your Gantt chart up-to-date to reflect current project status and any changes in the timeline.
- Communicate with Your Team: Share the Gantt chart with your team regularly to keep everyone aligned on tasks and timelines.
Conclusion:
A Gantt chart is a beneficial tool that helps one track time progress, prepare for challenges early, and coordinate resources. Following the steps highlighted above, we can create and use Gantt charts to keep our projects on course while maintaining your team’s alignment toward the end goals. Gantt charts can be a tad overwhelming to a beginner, but with practice, they become an intuitive view and management of the projects. Gantt charts are time-tested and still remain to be a simplifier of complex project workflows for veteran professionals.
By – Amanpreet Singh Bhogal